Calibrating a climate thermometer
In 2007, University of Groningen professor Harro Meijer went to Greenland to make some snow. He hoped that a thin layer of artificial snow on top of the huge ice cap would help him calibrate a thermometer to measure temperatures in Greenland over thousands of years. Things turned out to be a bit more complicated.
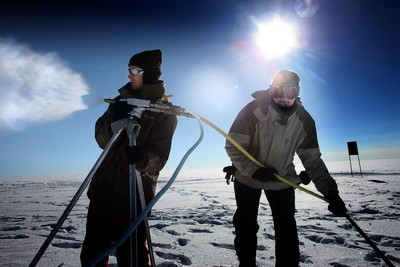
A big poster hangs on the wall of Meijer’s office in the Physics and Chemistry building on the Zernike Campus. Two men hold the muzzle of a snow cannon in an icy landscape. It is Meijer himself and his PhD student Gerko van der Wel making snow in Greenland. This might raise some eyebrows, but there was a good scientific reason for doing so.
At a thickness of some three kilometres, the Greenland ice sheet contains a frozen archive for climate scientists. The ice has accumulated over at least 100,000 years, as snow fell and was compressed into ice. Climate scientists have been studying ice cores for a long time to gather information on the ‘paleoclimate’. ‘One way to do this is to measure the concentration of 18O’, says Meijer. This is a heavier version of normal oxygen (16O), which carries two extra neutrons in its nucleus.
Direct measurement
As it is heavier, the 18O has slightly different physical properties, and this affects the evaporation and condensation of water containing these rare heavy oxygen atoms. The result is that the concentration of 18O in snow falling on Greenland is relatively low, and it differs in winter from summer. ‘Basically, the amount of 18O depends on the difference in temperature between the tropics, where water evaporates, and Greenland, where it comes down as snow.’
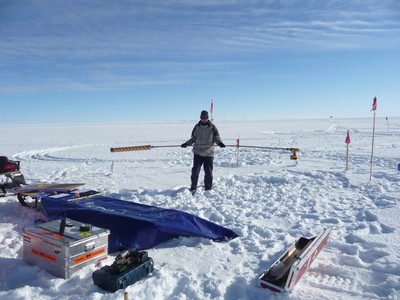
So when you measure 18O in ice core samples from different depths, the pattern tells you something about the temperature. ‘Up to about a thousand years back, we can see annual patterns of higher 18O during the summer. Below that, the annual signal is no longer visible, but you can follow temperature trends over longer periods.’
A drawback to the method is that the relationship between 18O in the snow and the actual temperature in Greenland is rather indirect. Many other factors between evaporation and deposition play a role. Then, around the year 2000, scientists came up with an alternative that promised more direct temperature measurement. Meijer: ‘Sigfus Johnson realized that the difference in diffusion between 18O and deuterium (2H), the heavy form of hydrogen, is mostly dependent on the temperature.’ Thus, this measurement would result in an absolute temperature measurement. ‘And that would be great news for climate scientists. We’d really like to know exactly how low temperatures dropped during the Last Glacial Maximum.’ This sort of information would improve our climate models.
Firn layer
However, the technique Johnson proposed also had some unknowns. ‘Diffusion takes place in what is known as the firn, the top 60 meters of the glacier where the snow has not yet been compressed to ice, so the temperature is an average of several decades.’ More importantly, the diffusion of both 18O and 2H was estimated from laboratory experiments.
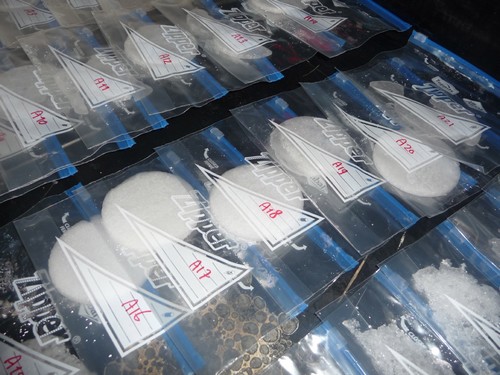
That is why Meijer went to Greenland: he wanted to test diffusion rates in real snow. He used water with added 2H to deposit a snow layer of a few centimetres on top of the ice cap. Over the next five years, he revisited the 6 x 6 meter location to extract shallow firn cores and measure the diffusion rates in them. The results were surprising. ‘According to the model, we should have seen six centimetres of diffusion over five years, but we found only four.’
This doesn’t invalidate the measurements, but it does mean the absolute temperature measurements can be off by a few degrees. There is a solution, says Meijer. ‘We should measure the diffusion over the entire 60 metre firn layer. That way, we would know the exact amount of diffusion, which we could correlate to information about temperature and precipitation.’ Johnson’s ‘thermometer’ would then be properly calibrated.
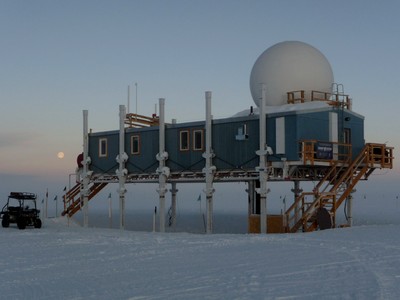
Meijer is still debating this experiment with colleagues. ‘It is a big project, possibly too big for our institute.’ The spot where he conducted his snow-making experiment would be ideal. ‘It’s called Summit, and there has been an American research station there since 1988, so we have lots of data and the infrastructure is excellent.’
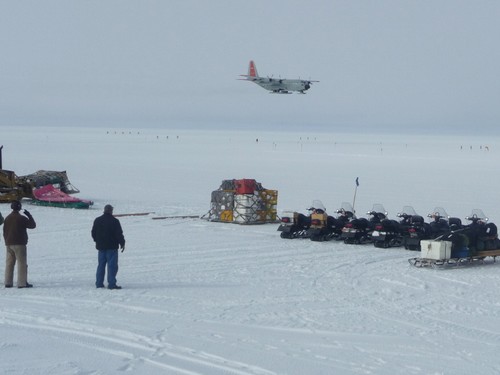
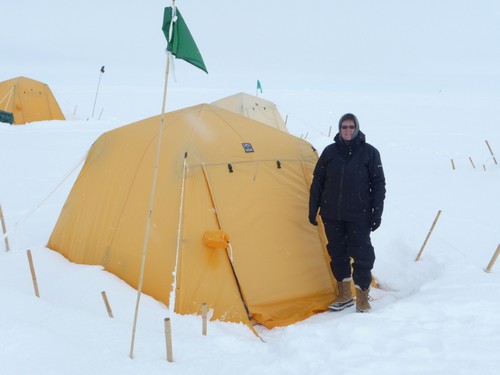
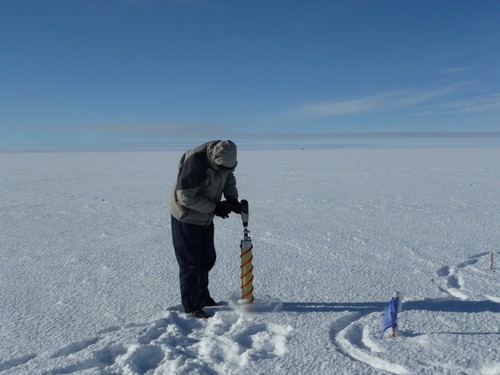
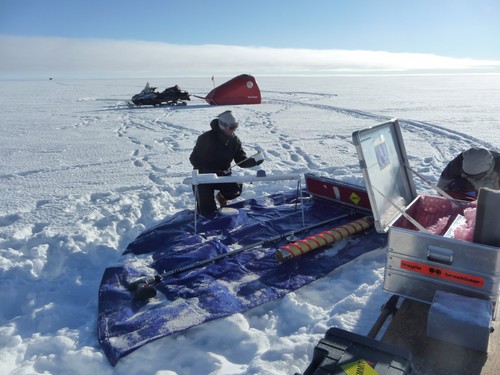
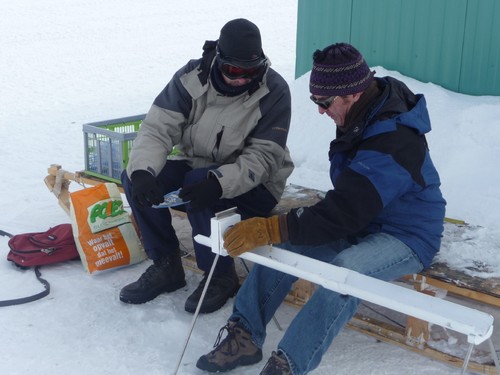
Summit was his second attempt at snow making: ‘We first tried it at a spot frequently visited by the University of Utrecht. At the highest location, temperatures were always below freezing point, which was what we needed, but to our embarrassment, we hadn’t factored in climate change. The year after we deposited our snow layer, it began to thaw in the summer, so we had to abandon that site.’ This just goes to show the importance of climate change research.
Reference: Van der Wel, L.G., Been, H.A., Van de Wal, R.S.W., Smeets, C.J.P.P. and Meijer, H.A.J. 2015. Constraints on the δ2H diffusion rate in firn from field measurements at Summit, Greenland. The Cryosphere. 9:1089–1103 (open access).
| Last modified: | 23 December 2016 12.50 p.m. |
More news
-
10 June 2024
Swarming around a skyscraper
Every two weeks, UG Makers puts the spotlight on a researcher who has created something tangible, ranging from homemade measuring equipment for academic research to small or larger products that can change our daily lives. That is how UG...
-
21 May 2024
Results of 2024 University elections
The votes have been counted and the results of the University elections are in!

