SIBES and Wadden Mosaic show powerline Wadden Sea planned straight through biodiversity hotspots
The projected powerline ‘Eemshaven West’, that may connect a new 700 MW wind park on the North Sea with the powerstation in Eemshaven, potentially crosses the Wadden Sea exactly in some of the most biodiverse hotspots. That is the conclusion drawn by Tjisse van der Heide, researcher at NIOZ and professor of coastal ecology at Groningen University, in a position paper he will present on 16 September to the Dutch Parliament.
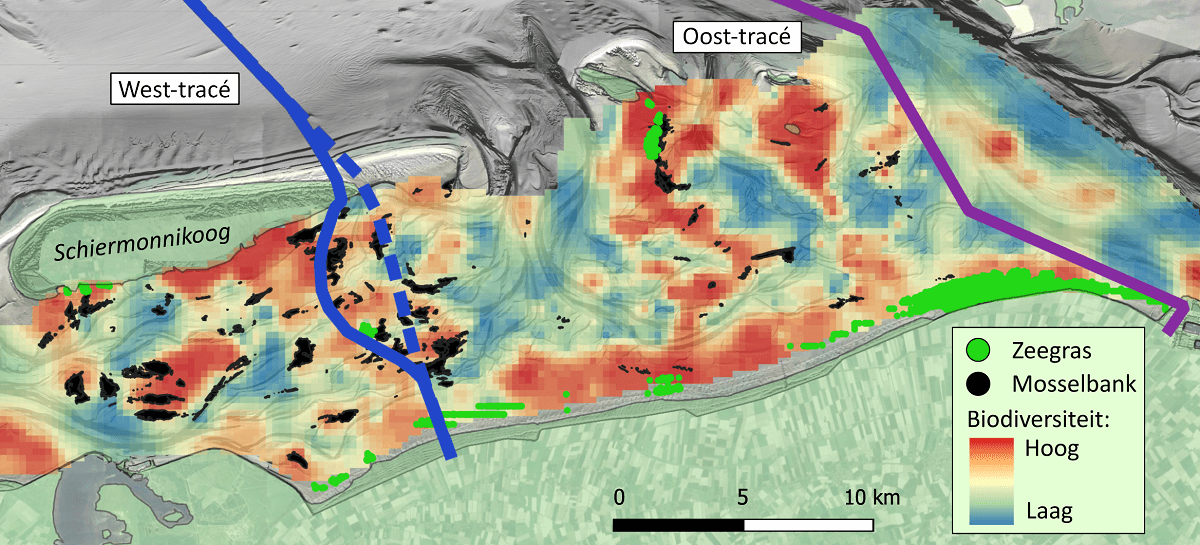
Combined maps SIBES and Wadden Mosaic
Van der Heide and colleagues combined recent sampling data of two monitoring programs: SIBES for the intertidal parts of the Wadden Sea and Wadden Mosaic for the permanently submerged, subtidal parts. Also, the location of current mussel beds and seagrasses, composed from cartographic data by Wageningen Marine Research and Rijkswaterstaat, were plotted on a map of the Wadden Sea. Van der Heide: “When we project the proposed trajectory of the powerline on top this map, we see that it crosses some of the richest areas with benthic life, including several mussel beds. The plans of the architects of this power network unintentionally happen to connect almost as many biodiversity hotspots as possible.”
The preference of engineers and benthic life
The trajectory of this powerline follows the area where the currents around the Wadden Islands meet. Therefore, this is the area with the least energy in currents of water or sediments. “It makes sense that the engineers chose this area to dig in their cable. It gives the least chance of it washing to the surface. However, these are also the richest areas of biodiversity. Benthic life thrives in less dynamic areas too.”
Intertidal and below the surface
The used biodiversity data were derived from the 2019 dataset of SIBES. “In this Synoptic Intertidal Benthic Survey, we literally take samples across all the intertidal areas of the Dutch Wadden Sea”, scientific coordinator Allert Bijleveld of NIOZ explains. “The strength of this dataset is its scale in both time and place. For assessing the importance of an area, you need to compare it to other areas of the Wadden Sea. We are also able to compare it with other years, going back as far as 2008.”
The SIBES data were combined with the 2019 data of Wadden Mosaic, the first year that the subtidal areas were sampled too. “We collected 1400 samples from areas that were previously mostly a ‘black spot’ in the ecological information on the Wadden Sea”, scientific coordinator of this program, Oscar Franken of NIOZ and University of Groningen explains.
This position paper was the very first occasion where data of SIBES and Wadden Mosaic were combined. “This first estimation of biodiversity already paints a grim picture for the ecological evaluation of the projected powerline”, Van der Heide says.
| Last modified: | 26 June 2024 12.11 p.m. |
More news
-
24 March 2025
UG 28th in World's Most International Universities 2025 rankings
The University of Groningen has been ranked 28th in the World's Most International Universities 2025 by Times Higher Education. With this, the UG leaves behind institutions such as MIT and Harvard. The 28th place marks an increase of five places: in...
-
05 March 2025
Women in Science
The UG celebrates International Women’s Day with a special photo series: Women in Science.
-
16 December 2024
Jouke de Vries: ‘The University will have to be flexible’
2024 was a festive year for the University of Groningen. In this podcast, Jouke de Vries, the chair of the Executive Board, looks back.